Tag Archives: SCM

optimization: a technical overview

(This is the fourth in the PuneTech series of articles on optimization by Dr. Narayan Venkatasubramanyan, an Optimization Guru and one of the original pioneers in applying Optimization to Supply Chain Management. The first one was an ‘overview’ case study of optimization. The second was architecture of a decision support system. The third was optimization and organizational readiness for change.

For Dr. Narayan Venkatasubramanyan’s detailed bio, please click here. For the full series of articles, click here.)

this is a follow-up to optimization: a case study. frequent references in this article to details in that article would make this one difficult to read for someone who hasn’t at least skimmed through that.

the problem of choice

the wikipedia article on optimization provides a great overview of the field. it does a thorough job by providing a brief history of the field of mathematical optimization, breaking down the field into its various sub-fields, and even making a passing reference to commercially available packages that help in the rapid development of optimization-based solutions. the rich set of links in this page lead to detailed discussions of each of the topics touched on in the overview.

i’m tempted to stop here and say that my job is done but there is one slight problem: there is a complete absence of any reference to helicopter scheduling in an offshore oil-field. not a trace!

this brings me to the biggest problem facing a young practitioner in the field: what to do when faced with a practical problem?

of course, the first instinct is to run with the technique one is most familiar with. being among the few in our mba program that had chosen the elective titled “selected topics in operations research” (a title that i’m now convinced was designed to bore and/or scare off prospective students who weren’t self-selected card-carrying nerds), we came to the problem of helicopter scheduling armed with a wealth of text-book knowledge.

an overview of linear programming

A series of linear constraints on two variable...
the lines represent the constraints. the blue region is the set of all “permissible values”. the objective function is used to choose one (“the most optimal”) out of the blue points. image via wikipedia

having recently studied linear and integer programming, we first tried to write down a mathematical formulation of the problem. we knew we could describe each sortie in terms of variables (known as decision variables). we then had to write down constraints that ensured the following:

  • any set of values of those decision variables that satisfied all the constrains would correspond to a sortie
  • any sortie could be described by a set of permissible set of values of those decision variables

this approach is one of the cornerstones of mathematical programming: given a practical situation to optimize, first write down a set of equations whose solutions have a one-to-one correspondence to the set of possible decisions. typically, these equations have many solutions.

click here for an animated presentation that shows how the solutions to a system of inequalities can be viewed graphically.

the other cornerstone is what is called an objective function, i.e., a mathematical function in those same variables that were used to describe the set of all feasible solutions. the solver is directed to pick the “best” solution, i.e., one that maximizes (or minimizes) the objective function.

the set of constraints and the objective function together constitute a mathematical programming problem. the solution that maximizes (or minimizes) the objective function is called an optimal solution.

linear programming – an example

googling for “linear programming examples” leads to millions of hits, so let me borrow an example at random from here: “A farmer has 10 acres to plant in wheat and rye. He has to plant at least 7 acres. However, he has only $1200 to spend and each acre of wheat costs $200 to plant and each acre of rye costs $100 to plant. Moreover, the farmer has to get the planting done in 12 hours and it takes an hour to plant an acre of wheat and 2 hours to plant an acre of rye. If the profit is $500 per acre of wheat and $300 per acre of rye how many acres of each should be planted to maximize profits?”

the decisions the farmer needs to make are: how many acres of wheat to plant? how many acres of rye to plant? let us call these x and y respectively.

so what values can x and y take?

  • since we know that he has only 10 acres, it is clear that x+y must be less than 10.
  • the problem says that he has to plant at least 7 acres. we have two choices: we can be good students and write down the constraint “x+y >= 7” or we can be good practitioners and demand to know more about the origins of this constraint (i’m sure every OR professional of long standing has scars to show from the times when they failed to ask that question.)
  • the budget constraint implies that 200x + 100y <= 1200. again, should we not be asking why this farmer cannot borrow money if doing so will increase his returns?
  • finally, the time constraint translates into x + 2y <= 12. can he not employ farm-hands to increase his options?
  • the non-negativity constraints (x, y >= 0) are often forgotten. in the absence of these constraints, the farmer could plant a negative amount of rye because doing so would seem to get him more land, more money, and more time. clearly, this is practically impossible.

as you will see if you were to scroll down that page, these inequalities define a triangular region in the x,y plane. all points on that triangle and its interior represents feasible solutions: i.e., if you were to pick a point, say (5,2), it means that the the farmer plants 5 acres each of wheat and 2 acres of rye. it is easy to confirm that this represents no more than 10 acres, no less than 7 acres, no more than $1200 and no more than 12 hours. but is this the best solution? or is there another point within that triangle?

this is where the objective function helps. the objective is to maximize the profit earner, i.e., maximize 500x + 300y. from among all the points (x,y) in that triangle, which one has the highest value for 500x + 300y?

this is the essence of linear programming. LPs are a subset of problems that are called mathematical programs.

real life isn’t always lp

in practice, not all mathematical programs are equally hard. as we saw above, if all the constraints and the objective function are linear in the decision variables and if the decision variables can take on any real value, we have a linear program. this is the easiest class of mathematical programs. linear programming models can be used to describe, sometimes approximately,a large number of commercially interesting problems like supply chain planning. commercial packages like OPL, GAMS, AMPL, etc can be used to model such problems without having to know much programming. packages like CPLEX can solve problems with millions of decision variables and constraints and produce an optimal solution in reasonable time. lately, there have been many open source solvers (e.g., GLPK) that have been growing in their capability and competing with commercial packages.

Illustrates a cutting plane algorithm to solve...
integer programming problems constrain the solution to specific discrete values. while the blue lines represent the “feasible region”, the solution is only allowed to take on values represented by the red dots. this makes the problem significantly more difficult. image via wikipedia

in many interesting commercial problems, the decision variables is required to take on discrete values. for example, a sortie that carries 1/3 of a passenger from point a to point b and transports the other 2/3 on a second flight from point a to point b would not work in practice. a helicopter that lands 0.3 in point c and 0.7 in point d is equally impractical. these variables have to be restricted to integer values. such problems are called integer programming problems. (there is a special class of problems in which the decision variables are required to be 0 or 1; such problems are called 0-1 programming problems.) integer programming problems are surprisingly hard to solve. such problems occur routinely in scheduling problems as well as in any problem that involves discrete decisions. commercial packages like CPLEX include a variety of sophisticated techniques to find good (although not always optimal) solutions to such problems. what makes these problems hard is the reality that the solution time for such problems grows exponentially with the growth in the size of the problem.

another class of interesting commercial problems involves non-linear constraints and/or objective functions. such problems occur routinely in situations such refinery planning where the dynamics of the process cannot be described (even approximately) with linear functions. some non-linear problems are relatively easy because they are guaranteed to have unique minima (or maxima). such well-behaved problems are easy to solve because one can always move along an improving path and find the optimal solution. when the functions involved are non-convex, you could have local minima (or maxima) that are worse than the global minima (or maxima). such problems are relatively hard because short-sighted algorithms could find a local minimum and get stuck in it.

fortunately for us, the helicopter scheduling problem had no non-linear effects (at least none that we accounted for in our model). unfortunately for us, the discrete constraints were themselves extremely hard to deal with. as we wrote down the formulation on paper, it became quickly apparent that the sheer size and complexity of the problem was beyond the capabilities of the IBM PC-XT that we had at our disposal. after kicking this idea around for a bit, we abandoned this approach.

resorting to heuristics

we decided to resort to a heuristic approach, i.e., an approach that used a set of rules to find good solutions to the problem. the approach we took involved the enumeration of all possible paths on a search tree and then an evaluation of those paths to find the most efficient one. for example, if the sortie was required to start at point A and drop off m1 men at point B and m2 men at point C, the helicopter could

  • leave point A with the m1 men and proceed to point B, or
  • leave point A with the m2 men and proceed to point C, or
  • leave point A with the m1 men and some of the m2 men and proceed to point B, or
  • leave point A with the m1 men and some of the m2 men and proceed to point C, or
  • . . .

if we were to select the first possibility, it would drop off the m1 men and then consider all the options available to it (return to A for the m2 men? fly to point D to refuel?)

we would then traverse this tree enumerating all the paths and evaluating them for their total cost. finally, we would pick the “best” path and publish it to the radio operator.

at first, this may seem ridiculous. the explosion of possibilities meant that this tree was daunting.

there were several ways around this problem. firstly, we never really explicitly enumerated all possible paths. we built out the possibilities as we went, keeping the best solution until we found one that was better. although the number of possible paths that a helicopter could fly in the course of a sortie was huge, there were simple rules that directed the search in promising directions so that the algorithm could quickly find a “good” sortie. once a complete sortie had been found, the algorithm could then use it to prune searches down branches that seemed to hold no promise for a better solution. the trick was to tune the search direction and prune the tree without eliminating any feasible possibilities. of course, aggressive pruning would speed up the search but could end up eliminating good solutions. similarly, good rules to direct the search could help find good solutions quickly but could defer searches in non-obvious directions. since we were limited in time, so the search tree was never completely searched, so if the rules were poor, good solutions could be pushed out so late in the search that they were never found, at least not in time to be implemented.

one of the nice benefits of this approach was that it allowed the radio operator to lock down the first few steps in the sortie and leave the computer to continue to search for a good solution for the remainder of the sortie. this allowed the optimizer to continue to run even after the sortie had begun. this bought the algorithm precious time. allowing the radio operator the ability to override also had the added benefit of putting the user in control in case what the system recommended was infeasible or undesirable.

notice that this approach is quite far from mathematical programming. there is no guarantee of an optimal solution (unless one can guarantee that pruning was never too aggressive and that we exhaustively searched the tree, neither of which could be guaranteed in practical cases). nevertheless, this turned out to be quite an effective strategy because it found a good solution quickly and then tried to improve on the solution within the time it was allowed.

traditional operations research vs. artificial intelligence

this may be a good juncture for an aside: the field of optimization has traditionally been the domain of operations researchers (i.e., applied mathematicians and industrial engineers). even though the field of artificial intelligence in computer science has been the source of many techniques that effectively solve many of the same problems as operations research techniques do, OR-traditionalists have always tended to look askance at their lowly competitors due to the perceived lack of rigour in the AI techniques. this attitude is apparent in the wikipedia article too: after listing all the approaches that are born from mathematical optimization, it introduces “non-traditional” methods with a somewhat off-handed “Here are a few other popular methods:” i find this both amusing and a little disappointing. there have been a few honest attempts at bringing these two fields together but a lot more can be done (i believe). it would be interesting to see how someone steeped in the AI tradition would have approached this problem. perhaps many of the techniques for directing the search and pruning the tree are specific instances of general approaches studied in that discipline.

if there is a moral to this angle of our off-shore adventures, it is this: when approaching an optimization problem, it is tempting to shoot for the stars by going down a rigorous path. often, reality intrudes. even when making technical choices, we need to account for the context in which the software will be used, how much time there is to solve the problem, what are the computing resources available, and how it will fit into the normal routine of work.

other articles in this series

this article is the fourth in the series of short explorations related to the application of optimization. i’d like to share what i’ve learned over a career spent largely in the business of applying optimization to real-world problems. interestingly, there is a lot more to practical optimization than models and algorithms. each of the the links leads to a piece that dwells on one particular aspect.

optimization: a case study
architecture of a decision-support system
optimization and organizational readiness for change
optimization: a technical overview (this article)

About the author – Dr. Narayan Venkatasubramanyan

Dr. Narayan Venkatasubramanyan has spent over two decades applying a rare combination of quantitative skills, business knowledge, and the ability to think from first principles to real world business problems. He currently consults in several areas including supply chain and health care management. As a Fellow at i2 Technologies, he tackled supply chains problems in areas as diverse as computer assembly, semiconductor manufacturer, consumer goods, steel, and automotive. Prior to that, he worked with several airlines on their aircraft and crew scheduling problems. He topped off his days at IIT-Bombay and IIM-Ahmedabad with a Ph.D. in Operations Research from the University of Wisconsin-Madison.

He is presently based in Dallas, USA and travels extensively all over the world during the course of his consulting assignments. You can also find Narayan on Linkedin at: http://www.linkedin.com/in/narayan3rdeye

Reblog this post [with Zemanta]

Optimization and Organizational Readiness for Change

(This is the third in the PuneTech series of articles on optimization by Dr. Narayan Venkatasubramanyan, an Optimization Guru and one of the original pioneers in applying Optimization to Supply Chain Management. The first one was an ‘overview’ case study of optimization. The second was architecture of a decision support system.

For Dr. Narayan Venkatasubramanyan’s detailed bio, please click here. For the full series of articles, click here.)

this is a follow-up to optimization: a case study. frequent references in this article to details in that article would make this one difficult to read for someone who hasn’t at least skimmed through that.

organizational dynamics

most discussions of optimization tend to focus on the technical details of problem formulation, algorithm design, the use of commercially available software, implementation details, etc. a fundamental point gets lost in that approach to this topic. in this piece, we will focus on that point: organizational readiness for change.

the introduction of optimization in the decision-making process almost always requires change in that process. processes exist in the context of an organization. as such, when introducing change of this nature, organizations need to be treated much the same way a doctor would treat a recipient of an organ. careful steps need to be take to make sure that the organization is receptive to change. before the change is introduced, the affected elements in the organization need to be made aware of the need for change. also, the organization’s “immune system” needs to be neutralized while the change is introduced. the natural tendency of any organization to attack change and frustrate the change agent needs to be foreseen and planned for.

the structure of the client’s project organization is critical. in my experience, every successful implementation of optimization has required support at 3 levels within the client organization:

  1. a project needs “air cover” from the executive level.
  2. at the project level, it needs a champion who will serve as the subject-matter expert, evangelist, manager, and cheerleader.
  3. at the implementation level, it needs a group of people who are intimately familiar with the inner workings of the existing IT infrastructure.

let me elaborate on that with specific emphasis on the first two:

an executive sponsor is vital to ensuring that the team is given the time and resources it needs to succeed even as changes in circumstances cause high-level priorities to change. during the gestation period of a project — a typical project tends to take several months — the project team needs the assurance that their budget will be safe, the priorities that guide their work will remain largely unchanged, and the team as a whole will remain free of distractions.

a project champion is the one person in the client organization whose professional success is completely aligned with the success of the project. he/she stands to get a huge bonus and/or a promotion upon the success of the project. such a person keeps the team focused on the deliverable, keeps the executive sponsor armed with all the information he/she needs to continue to make the case for the project, and keeps all affected parties informed of impending changes, in short, an internal change agent. in order to achieve this, the champion has to be from the business end of the organization, not from the IT department.

unfortunately, most projects tend to focus on the third of the elements. strength in the implementation team alone will not save project that lacks a sponsor or a champion.

Dhruv
ONGC’s HAL Dhruv Helicopters on sorties off the Mumbai coast. Image by Premshree Pillai via Flickr

let us examine the helicopter scheduling project in this light.

it could be argued that executive sponsorship for this project came from the highest possible level. i heard once that our project had been blessed by the managing directors of the two companies. unfortunately, their involvement didn’t extend anywhere beyond that. neither managing director helped shape the project organization for success.

who was our champion? there was one vitally important point that i mentioned in passing in the original narrative: the intended users of the system were radio operators. they reported to an on-shore manager in the electronics & telecommunication department. in reality, their work was intimately connected to the production department, i.e., the department that managed the operations in the field. as such, they were effectively reporting to the field production supervisor. the radio operators worked very much like the engineers in the field: they worked all day every day for 14 days at a time and then went home for the next 2 weeks. each position was manned by two radio operators — more about them later — who alternately occupied the radio room. as far as their helicopter-related role was concerned, they were expected to make sure that they did the best they could do to keep operations going as smoothly as possible. their manager, the person who initiated the project, had no direct control over the activities of the radio operator. meanwhile, the field production supervisor was in charge of maintaining the efficient flow of oil out of the field. the cost of helicopter operations was probably a miniscule fraction of the picture they viewed. because no one bore responsibility for the efficiency of helicopter usage, no one in the client organization really cared about the success of our project. unfortunately, we were neither tasked nor equipped to deal with this problem (although that may seem odd considering that there were two fresh MBAs on the team).

in hindsight, it seems like this project was ill-structured right from the beginning. the project team soldiered on in the face of these odds, oblivious to the fact that we’d been dealt a losing hand. should the final outcome have ever been a surprise?

other articles in this series

this article is the third in a series of short explorations related to the application of optimization. i’d like to share what i’ve learned over a career spent largely in the business of applying optimization to real-world problems. interestingly, there is a lot more to practical optimization than models and algorithms. each of the the links below leads to a piece that dwells on one particular aspect.

optimization: a case study
architecture of a decision-support system
optimization and organizational readiness for change (this article)
optimization: a technical overview

About the author – Dr. Narayan Venkatasubramanyan

Dr. Narayan Venkatasubramanyan has spent over two decades applying a rare combination of quantitative skills, business knowledge, and the ability to think from first principles to real world business problems. He currently consults in several areas including supply chain and health care management. As a Fellow at i2 Technologies, he tackled supply chains problems in areas as diverse as computer assembly, semiconductor manufacturer, consumer goods, steel, and automotive. Prior to that, he worked with several airlines on their aircraft and crew scheduling problems. He topped off his days at IIT-Bombay and IIM-Ahmedabad with a Ph.D. in Operations Research from the University of Wisconsin-Madison.

He is presently based in Dallas, USA and travels extensively all over the world during the course of his consulting assignments. You can also find Narayan on Linkedin at: http://www.linkedin.com/in/narayan3rdeye

Reblog this post [with Zemanta]

Architecture of a decision-support system

(PuneTech is honored to have Dr. Narayan Venkatasubramanyan, an Optimization Guru and one of the original pioneers in applying Optimization to Supply Chain Management, as our contributor. I had the privilege of working closely with Narayan at i2 Technologies in Dallas for nearly 10 years.

For Dr. Narayan Venkatasubramanyan’s detailed bio, please click here.

This is the second in a series of articles that we will publish once a week for a month. The first one was an ‘overview’ case study of optimization. Click here for the full series.)

this is a follow-up to optimization: a case study. frequent references in this article to details in that article would make this one difficult to read for someone who hasn’t at least skimmed through that.


a layered view of decision-support systems

it is useful to think of a decision-support system as consisting of 4 distinct layers:

  1. data layer
  2. visibility layer
  3. predictive/simulation layer
  4. optimization layer

the job of the data layer is to capture all the data that is relevant and material to the decision at hand and to ensure that this data is correct, up-to-date, and easily accessible. in our case, this would include master/static data such as the map of the field, the operating characteristics of the helicopter, etc as well as dynamic data such as the requirements for the sortie, ambient conditions (wind, temperature), etc. this may seem rather obvious at first sight but a quick reading of the case study shows that we had to revisit the data layer several times over the course of the development of the solution.

as the name implies, the visibility layer provides visibility into the data in a form that allows a human user to exercise his/her judgment. very often, a decision-support system requires no more than just this layer built on a robust data layer. for example, we could have offered a rather weak form of decision support by automating the capture of dynamic data and presenting to the radio operator all the data (both static and dynamic), suitably filtered to incorporate only parts of the field that are relevant to that sortie. he/she would be left to chart the route of the helicopter on a piece of paper, possibly checking off requirements on the screen as they are satisfied. even though this may seem trivial, it is important to note that most decision-support systems in everyday use are rather lightweight pieces of software that present relevant data to a human user in a filtered, organized form. the human decision-maker takes it from there.

the predictive/simulation layer offers an additional layer of help to the human decision-maker. it has the intelligence to assess the decisions made (tentatively) by the user but offers no active support. for instance, a helicopter scheduling system that offers this level of support would present the radio operator with a screen on which the map of the field and the sortie’s requirements are depicted graphically. through a series of mouse-clicks, the user can decide whom to pick up, where to fly to, whether to refuel, etc. the system supports the user by automatically keeping track of the weight of the payload (passenger+fuel) and warning the user of violations, using the wind direction to compute the rate of fuel burn, warning the user of low-fuel conditions, monitoring whether crews arrive at their workplace on time, etc. in short, the user makes decisions, the system checks constraints and warns of violations, and provides a measure of goodness of the solution. few people acknowledge that much of corporate decision-making is at this level of sophistication. the widespread use of microsoft excel is clear evidence of this.

the optimization layer is the last of the layers. it wrests control from the user and actively recommends decisions. it is obvious that the effectiveness of optimization layer is vitally dependent on the data layer. what is often overlooked is that the acceptance of the optimization layer by the human decision-maker often hinges on their ability to tweak the recommendations in the predictive layer, even if only to reassure themselves that the solution is correct. often, the post-optimization adjustments are indispensable because the human decision-maker knows things that the system does not.

the art (and science) of modeling

the term “decision-support system” may seem a little archaic but i will use it here because my experience with applying optimization has been in the realm of systems that recommend decisions, not ones that execute them. there is always human intervention that takes the form of approval and overrides. generally speaking, this is a necessary step. the system is never all-knowing. as a result, its view of reality is limited, possibly flawed. these limitations and flaws are reflected in its recommendations.

this invites the question: if there are known limitations and flaws in the model, why not fix them?

this is an important question. the answer to this is not nearly as obvious as it may appear.

before we actually construct a model of reality, we must consciously draw a box around that portion of reality that we intend to include in the model. if the box is drawn too broadly, the model will be too complex to be tractable. if the box is drawn too tightly, vital elements of the model are excluded. it is rare to find a decision problem in which we find a perfect compromise, i.e., we are able to draw a box that includes all aspects of the problem without the problem becoming computationally intractable.

unfortunately, it is hard to teach the subtleties of modeling in a classroom. in an academic setting, it is hard to wrestle with the messy job of making seemingly arbitrary choices about what to leave in and what to exclude. therefore, most students of optimization enter the real world with the impression that the process of modeling is quick and easy. on the contrary, it is at this level that most battles are won or lost.

note: the term modeling is going to be unavoidably overloaded in this context. when i speak of models, students of operations research may immediately think in terms of mathematical equations. those models are still a little way down the road. at this point, i’m simply talking about the set of abstract interrelationships that characterize the behaviour of the system. some of these relationships may be too complex to be captured in a mathematical model. as a result, the mathematical model is yet another level removed from reality.

consider our stumbling-and-bumbling approach to modeling the helicopter scheduling problem. we realized that the problem we faced wasn’t quite a text-book case. our initial approach was clearly very narrow. once we drew that box, our idealized world was significantly simpler than the real world. our world was flat. our helicopter never ran out of fuel. the amount of fuel it had was never so much that it compromised its seating capacity. it didn’t care which way the wind was blowing. it didn’t care how hot it was. in short, our model was far removed from reality. we had to incorporate each of these effects, one by one, because their exclusion made the gap between reality and model so large that the decisions recommended by the model were grossly unrealistic.

it could be argued that we were just a bunch of kids who knew nothing about helicopters, so trial-and-error was the only approach to determining the shape of the box we had to draw.

not true! here’s how we could have done it differently:

if you were to examine what we did in the light of the four-layer architecture described above, you’d notice that we really only built two of the four: the data layer and the optimization layer. this is a tremendously risky approach, an approach that has often led to failure in many other contexts. it must be acknowledged that optimization experts are rarely experts in the domain that they are modeling. nevertheless, by bypassing the visibility and predictive layers, we had sealed off our model from the eyes of people who could have told us about the flaws in it.

each iteration of the solution saw us expanding the data layer on which the software was built. in addition to expanding that data layer, we had to enhance the optimization layer to incorporate the rules implicit in the new pieces of data. here are the steps we took:

  1. we added the fuel capacity and consumption rate of each helicopter to the data layer. and modified the search algorithm to “remember” the fuel level and find its way to a fuel stop before the chopper plunged into the arabian sea.
  2. we added the payload limit to the data layer. and further modified search algorithm to “remember” not to pick up too many passengers too soon after refueling or risk plunging into the sea with 12 people on board.
  3. we captured the wind direction in the data layer and modified the computation of the distance matrix used in the optimization layer.
  4. we captured the ambient temperature as well as the relationship between temperature and maximum payload in the data layer. and we further trimmed the options available to the search algorithm.

we could have continued down this path ad infinitum. at each step, our users would have “discovered” yet another constraint for us to include. back in those days, ongc used to charter several different helicopter agencies. i remember one of the radio operator telling me that some companies were sticklers for the rules while others would push things to the limit. as such, a route was feasible or not depending on whether the canadian company showed up or the italian one did! should we have incorporated that too in our model? how is one to know?

this question isn’t merely rhetorical. the incorporation of a predictive/simulation layer puts the human decision-maker in the driver’s seat. if we had had a simulation layer, we would have quickly learned the factors that were relevant and material to the decision-making process. if the system didn’t tell the radio operator which way the wind was blowing, he/she would have immediately complained because it played such a major role in their choice. if the system didn’t tell him/her whether it was the canadian or the italian company and he didn’t ask, we would know it didn’t matter. in the absence of that layer, we merrily rushed into what is technically the most challenging aspect of the solution.

implementing an optimization algorithm is no mean task. it is hugely time-consuming, but that is really the least of the problems. optimization algorithms tend to be brittle in the following sense: a slight change in the model can require a complete rewrite of the algorithm. it is but human that once one builds a complex algorithm, one tends to want the model to remain unchanged. one becomes married to that view of the world. even in the face of mounting evidence that the model is wrong, one tends to hang on. in hindsight, i would say we made a serious mistake by not architecting the system to validate the correctness of the box we had drawn before we rushed ahead to building an optimization algorithm. in other words, if we had built the solution systematically, layer by layer, many of the surprises that caused us to swing wildly between jubilation and depression would have been avoided.

other articles in this series

this article is the second in a series of short explorations related to the application of optimization. i’d like to share what i’ve learned over a career spent largely in the business of applying optimization to real-world problems. interestingly, there is a lot more to practical optimization than models and algorithms. each of the the links below leads to a piece that dwells on one particular aspect.
articles in this series:
optimization: a case study
architecture of a decision-support system (this article)
optimization and organizational readiness for change
optimization: a technical overview

About the author – Dr. Narayan Venkatasubramanyan

Dr. Narayan Venkatasubramanyan has spent over two decades applying a rare combination of quantitative skills, business knowledge, and the ability to think from first principles to real world business problems. He currently consults in several areas including supply chain and health care management. As a Fellow at i2 Technologies, he tackled supply chains problems in areas as diverse as computer assembly, semiconductor manufacturer, consumer goods, steel, and automotive. Prior to that, he worked with several airlines on their aircraft and crew scheduling problems. He topped off his days at IIT-Bombay and IIM-Ahmedabad with a Ph.D. in Operations Research from the University of Wisconsin-Madison.

He is presently based in Dallas, USA and travels extensively all over the world during the course of his consulting assignments. You can also find Narayan on Linkedin at: http://www.linkedin.com/in/narayan3rdeye

Reblog this post [with Zemanta]

Optimization: A case study

(PuneTech is honored to have Dr. Narayan Venkatasubramanyan, an Optimization Guru and one of the original pioneers in applying Optimization to Supply Chain Management, as our contributor. I had the privilege of working closely with Narayan at i2 Technologies in Dallas for nearly 10 years.

PuneTech has published some introductory articles on Supply Chain Management (SCM) and the optimization & decision support challenges involved in various real world SCM problems. Who better to write about this area in further depth than Narayan!

For Dr. Narayan Venkatasubramanyan’s detailed bio, please click here.

This is the first in a series of articles that we will publish once a week for a month. For the full series of articles, click here.)

the following entry was prompted by a request for an article on the topic of “optimization” for publication in punetech.com, a website co-founded by amit paranjape, a friend and former colleague. for reasons that may have something to do with the fact that i’ve made a living for a couple of decades as a practitioner of that dark art known as optimization, he felt that i was best qualified to write about the subject for an audience that was technically savvy but not necessarily aware of the application of optimization. it took me a while to overcome my initial reluctance: is there really an audience for this after all, even my daughter feigns disgust every time i bring up the topic of what i do. after some thought, i accepted the challenge as long as i could take a slightly unusual approach to a “technical” topic: i decided to personalize it by rooting in a personal-professional experience. i could then branch off into a variety of different aspects of that experience, some technical, some not so much. read on …

background

the year was 1985. i was fresh out of school, entering the “real” world for the first time. with a bachelors in engineering from IIT-Bombay and a graduate degree in business from IIM-Ahmedabad, and little else, i was primed for success. or disaster. and i was too naive to tell the difference.

for those too young to remember those days, 1985 was early in rajiv gandhi‘s term as prime minister of india. he had come in with an obama-esque message of change. and change meant modernization (he was the first indian politician with a computer terminal situated quite prominently in his office). for a brief while, we believed that india had turned the corner, that the public sector companies in india would reclaim the “commanding heights” of the economy and exercise their power to make india a better place.

CMC was a public sector company that had inherited much of the computer maintenance business in india after IBM was tossed out in 1977. quickly, they broadened well beyond computer maintenance into all things related to computers. that year, they recruited heavily in IIM-A. i was one of an unusually large number of graduates who saw CMC as a good bet.

not too long into my tenure at at CMC, i was invited to meet with an mid-level manager in electronics & telecommunications department of the oil and natural gas commission of india (ONGC). the challenge he posed us was simple: save money by optimizing the utilization of helicopters in the bombay high oilfield.

the problem

the bombay high offshore oilfield, the setting of our story

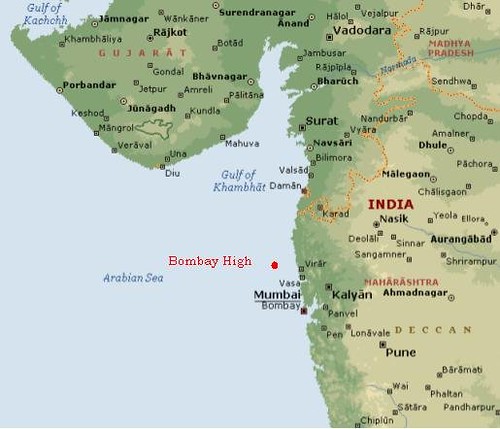
the bombay high oilfield is about 100 miles off the coast of bombay (see map). back then, it was a collection of about 50 oil platforms, divided roughly into two groups, bombay high north and bombay high south.

(on a completely unrelated tangent: while writing this piece, i wandered off into searching for pictures of bombay high. i stumbled upon the work of captain nandu chitnis, ex-navy now ONGC, biker, amateur photographer … who i suspect is a pune native. click here for a few of his pictures that capture the outlandish beauty of an offshore oil field.)

movement of personnel between platforms in each of these groups was managed by a radio operator who was centrally located.

all but three of these platforms were unmanned. this meant that the people who worked on these platforms had to be flown out from the manned platforms every morning and brought back to their base platforms at the end of the day.

at dawn every morning, two helicopters, flew out from the airbase in juhu, in northwestern bombay. meanwhile, the radio operator in each field would get a set of requirements of the form “move m men from platform x to platform y”. these requirements could be qualified by time windows (e.g., need to reach y by 9am, or not available for pick-up until 8:30am) or priority (e.g., as soon as possible). each chopper would arrive at one of the central platforms and gets its instructions for the morning sortie from the radio operator. after doing its rounds for the morning, it would return to the main platform. at lunchtime, it would fly lunchboxes to the crews working at unmanned platforms. for the final sortie of the day, the radio operator would send instructions that would ensure that all the crews are returned safely to their home platforms before the chopper was released to return to bombay for the night.

the challenge for us was to build a computer system that would optimize the use of the helicopter. the requirements were ad hoc, i.e., there was no daily pattern to the movement of men within the field, so the problem was different every day. it was believed that the routes charted by the radio operator were inefficient. given the amount of fuel used in these operations, an improvement of 5% over what they did was sufficient to result in a payback period of 4-6 months for our project.

this was my first exposure to the real world of optimization. a colleague of mine — another IIM-A graduate and i — threw ourselves at this problem. later, we were joined yet another guy, an immensely bright guy who could make the lowly IBM PC-XT — remember, this was the state-of-the-art at that time — do unimaginable things. i couldn’t have asked to be a member of a team that was better suited to this job.

the solution

we collected all the static data that we thought we would need. we got the latitude and longitude of the on-shore base and of each platform (degrees, minutes, and seconds) and computed the distance between every pair of points on our map (i think we even briefly flirted with the idea of correcting for the curvature of the earth but decided against it, perhaps one of the few wise moves we made). we got the capacity (number of seats) and cruising speed of each of the helicopters.

we collected a lot of sample data of actual requirements and the routes that were flown.

we debated the mathematical formulation of the problem at length. we quickly realized that this was far harder than the classical “traveling salesman problem”. in that problem, you are given a set of points on a map and asked to find the shortest tour that starts at any city and touches every other city exactly once before returning to the starting point. in our problem, the “salesman” would pick and/or drop off passengers at each stop. the number he could pick up was constrained, so this meant that he could be forced to visit a city more than once. the TSP is known to be a “hard” problem, i.e., the time it takes to solve it grows very rapidly as you increase the number of cities in the problem. nevertheless, we forged ahead. i’m not sure if we actually completed the formulation of an integer programming problem but, even before we did, we came to the conclusion that this was too hard of a problem to be solved as an integer program on a first-generation desktop computer.

instead, we designed and implemented a search algorithm that would apply some rules to quickly generate good routes and then proceed to search for better routes. we no longer had a guarantee of optimality but we figured we were smart enough to direct our search well and make it quick. we tested our algorithm against the test cases we’d selected and discovered that we were beating the radio operators quite handily.

then came the moment we’d been waiting for: we finally met the radio operators.

they looked at the routes our program was generating. and then came the first complaint. “your routes are not accounting for refueling!”, they said. no one had told us that the sorties were long enough that you could run out of fuel halfway, so we had not been monitoring that at all!

Dhruv
ONGC’s HAL Dhruv Helicopters on sorties off the Mumbai coast. Image by Premshree Pillai via Flickr

so we went back to the drawing board. we now added a new dimension to the search algorithm: it had to keep track of fuel and, if it was running low on fuel during the sortie, direct the chopper to one of the few fuel bases. this meant that some of the routes that we had generated in the first attempt were no longer feasible. we weren’t beating the radio operators quite as easily as before.

we went back to the users. they took another look at our routes. and then came their next complaint: “you’ve got more than 7 people on board after refueling!”, they said. “but it’s a 12-seater!”, we argued. it turns out they had a point: these choppers had a large fuel tank, so once they topped up the tank — as they always do when they stop to refuel — they were too heavy to take a full complement of passengers. this meant that the capacity of the chopper was two-dimensional: seats and weight. on a full tank, weight was the binding constraint. as the fuel burned off, the weight constraint eased; beyond a certain point, the number of seats became the binding constraint.

we trooped back to the drawing board. “we can do this!”, we said to ourselves. and we did. remember, we were young and smart. and too stupid to see where all this was going.

in our next iteration, the computer-generated routes were coming closer and closer to the user-generated ones. mind you, we were still beating them on an average but our payback period was slowly growing.

we went back to the users with our latest and greatest solution. they looked at it. and they asked: “which way is the wind blowing?” by then, we knew not to ask “why do you care?” it turns out that helicopters always land and take-off into the wind. for instance, if the chopper was flying from x to y and the wind was blowing from y to x, the setting was perfect. the chopper would take off from x in the direction of y and make a bee-line for y. on the other hand, if the wind was also blowing from x to y, it would take off in a direction away from y, do a 180-degree turn, fly toward and past y, do yet another 180-degree turn, and land. given that, it made sense to keep the chopper generally flying a long string of short hops into the wind. when it could go no further because they fuel was running low or it needed to go no further in that direction because there were no passengers on board headed that way, then and only then, did it make sense to turn around and make a long hop back.

“bloody asymmetric distance matrix!”, we mumbled to ourselves. by then, we were beaten and bloodied but unbowed. we were determined to optimize these chopper routes, come hell or high water!

so back we went to our desks. we modified the search algorithm yet another time. by now, the code had grown so long that our program broke the limits of the editor in turbo pascal. but we soldiered on. finally, we had all of our users’ requirements coded into the algorithm.

or so we thought. we weren’t in the least bit surprised when, after looking at our latest output, they asked “was this in summer?”. we had now grown accustomed to this. they explained to us that the maximum payload of a chopper is a function of ambient temperature. on the hottest days of summer, choppers have to fly light. on a full tank, a 12-seater may now only accommodate 6 passengers. we were ready to give up. but not yet. back we went to our drawing board. and we went to the field one last time.

in some cases, we found that the radio operators were doing better than the computer. in some cases, we beat them. i can’t say no creative accounting was involved but we did manage to eke out a few percentage point of improvement over the manually generated routes.

epilogue

you’d think we’d won this battle of attrition. we’d shown that we could accommodate all of their requirements. we’d proved that we could do better than the radio operators. we’d taken our machine to the radio operators cabin on the platform and installed it there.

we didn’t realize that the final chapter hadn’t been written. a few weeks after we’d declared success, i got a call from ONGC. apparently, the system wasn’t working. no details were provided.

i flew out to the platform. i sat with the radio operator as he grudgingly input the requirements into the computer. he read off the output from the screen and proceeded with this job. after the morning sortie was done, i retired to the lounge, glad that my work was done.

a little before lunchtime, i got a call from the radio operator. “the system isn’t working!”, he said. i went back to his cabin. and discovered that he was right. it is not that our code had crashed. the system wouldn’t boot. when you turned on the machine, all you got was a lone blinking cursor on the top left corner of the screen. apparently, there was some kind of catastrophic hardware failure. in a moment of uncommon inspiration, i decided to open the box. i fiddled around with the cards and connectors, closed the box, and fired it up again. and it worked!

it turned out that the radio operator’s cabin was sitting right atop the industrial-strength laundry room of the platform. every time they turned on the laundry, everything in the radio room would vibrate. there was a pretty good chance that our PC would regress to a comatose state every time they did the laundry. i then realized that this was a hopeless situation. can i really blame a user for rejecting a system that was prone to frequent and total failures?

other articles in this series

this blog entry is intended to set the stage for a series of short explorations related to the application of optimization. i’d like to share what i’ve learned over a career spent largely in the business of applying optimization to real-world problems. interestingly, there is a lot more to practical optimization than models and algorithms. each of the the links below leads to a piece that dwells on one particular aspect.

optimization: a case study (this article)
architecture of a decision-support system
optimization and organizational readiness for change
optimization: a technical overview

About the author – Dr. Narayan Venkatasubramanyan

Dr. Narayan Venkatasubramanyan has spent over two decades applying a rare combination of quantitative skills, business knowledge, and the ability to think from first principles to real world business problems. He currently consults in several areas including supply chain and health care management. As a Fellow at i2 Technologies, he tackled supply chains problems in areas as diverse as computer assembly, semiconductor manufacturer, consumer goods, steel, and automotive. Prior to that, he worked with several airlines on their aircraft and crew scheduling problems. He topped off his days at IIT-Bombay and IIM-Ahmedabad with a Ph.D. in Operations Research from the University of Wisconsin-Madison.

He is presently based in Dallas, USA and travels extensively all over the world during the course of his consulting assignments. You can also find Narayan on Linkedin at: http://www.linkedin.com/in/narayan3rdeye

Reblog this post [with Zemanta]

Inside a Retail Supply Chain: How did ‘Maha’ DeshMart Survive the Economic Slowdown and Thrive

Wal-Mart Hermosillo
Image via Wikipedia

‘Maha’ DeshMart is a large (fictional) supermarket chain with a pan-India presence. Amit Paranjape, our resident expert on Supply Chain Management, discusses some of their management strategies and best practices. Special emphasis is put on the importance of ‘Information Technology’ and how it enables ‘Maha’ DeshMart to run one of the most efficient Supply Chain & Operations. Benchmarking is also done with global industry leaders such as Wal-Mart. 2008 represented a challenging year and we will take a look at how specific Supply Chain Processes and the other aspects of Retail Operations react to the global economic challenges, and can still deliver on the overall goals and objectives of the company. This fictional story about the fictional ‘Maha’ DeshMart is in continuation to our series of articles on Supply Chain Management.

‘Maha’ DeshMart

‘Maha’ DeshMart as the name suggests stands for everything ‘large’ (‘Maha’ in Hindi / Marathi / Sanskrit = ‘Large’ or Huge’). Some say ‘Maha’ also stands for ‘Maharashtra’ the home state of the founder, Raj Deshpande. ‘Desh’ comes from the founder’s last name. This chain is also often referred to as simply ‘DeshMart’. Ever since opening its first store in Pune about 15 years back, it has gone through a rapid expansion and now had a presence in every major Tier 1 and Tier 2 city in India, with aggressive plans to expand to Tier 3 cities as well. DeshMart’s vision is to be the most preferred shopping destination for the Indian consumer; period. To achieve this, they want to have the widest choices, the best prices, and the most comfortable shopping experience for their consumers.

It is no secret that the DeshMart founder was inspired by world leader in retail, Wal-Mart, and its philosophy of scale and constantly driving down costs. The Wal-Mart business model is actively pursued here in their Pune headquarters, as well as in all their stores and throughout their supply chain. The management team though has taken a series of strategic decisions to ‘Indianize’ the model to suit the local context. For example, while ‘ELDP’ (Every Day Low Prices, as opposed to Promotions) was the generally preferred strategy, some key exceptions were made based on local preferences. The other one is to enshrine a ‘Neighborhood Kirana Store’ owner type mentality into the Store Manager and his team. In India, the small neighborhood ‘Kirana’ (or grocery) store is run by a family with the patriarch serving as the CEO, Head of Operations, and all other roles combined. The rest of family fills up various other support roles. One thing this model provides is an ‘amazing’ ownership of the business and the consumer. DeshMart wanted its Store Managers to think and act, like the Kirana Store Owner. Metrics have been suitably adjusted to encourage the right behavior; however the core difference has been through intense focus on Hiring & Recruitment. Extraordinary importance is put on finding the right talent for these critical positions.

The Importance of Information Technology

Another key Wal-Mart strategy that has been espoused by DeshMart is focus on Information Technology. At DeshMart, IT is considered to be one of their biggest strategic differentiators. They don’t want to rely on any one or even a few different application software vendors for their business process applications. Instead, they have followed the example of Wal-Mart, Dell, FedEx, and Toyota and have taken complete ownership of their IT Applications & Infrastructure. These great companies have supported their unique business processes by designing and developing their own IT solutions where necessary. Here again, DeshMart put lot of emphasis on hiring the right CIO (Chief Information Officer). In fact in the early 1990s, when this position was virtually unknown in India and in many other places around the world – they had a CIO and his senior team in place.

The IT Department’s mission is to deliver the requisite data and decision making capabilities at the disposal of every DeshMart employee throughout the organization, in order to deliver on the overall goals & objectives of the company. Organizationally, IT was aligned along with the business process teams in such a way that for every project there was no ‘IT vs. Business’ division. The combined team had the singular goal to achieve the necessary process improvement metric.

The 2008 Global Economic Slowdown

The 2008 Global Economic Slowdown was not predicted by even the top experts on Wall Street. Thus, even the best of the supply chain leaders didn’t have any ability to accurately forecast the impending shortfall in demand. The only way for a company to react to something like this was through some rapid adjustments to their plans, and execute as efficiently as possible. The first signs of the slowdown were visible too late for planning the 2008 season. In the following sections, we will look at how DeshMart’s IT and Business Processes reacted to this challenge.

Merchandizing & Assortment Planning

Let us take a step back here and understand how large multi-product category retailers worldwide do their long term planning. For many retailers, especially for those heavily weighted towards fashion segment, the holiday season (last 5-6 weeks of the year, in the US – from Thanksgiving weekend to Christmas/New Year) could account for anywhere from 20% to even 50% of their annual revenues. In India, the holiday season traditionally runs from Diwali (The Festival of Lights), in October/November to the December End wedding season. Similar holiday season spikes are also observed in the Indian market.

To react to this end of the year demand, retailers start planning a year in advance. The overall merchandizing decisions (deciding what products to buy and position in the stores) are the first step. This process is called as ‘Merchandize Planning’. A ‘top down view’ is often a starting point, where a revenue forecast is broken down across different product groups (commonly referred to as ‘categories’) and then finally to the individual product (e.g. a pair of pants). Similarly, a geographic top down view is taken where the global revenue number is broken down by regions and eventually down to the store level. A ‘bottom up’ view can be taken based on actual product level forecasts. Often times, ‘middle-out’ view is also done at one of the intermediate points in the hierarchies. All these views are synchronized closely before arriving at final numbers and targets. This process sounds straight forward, but is complicated by the sheer size of the retail problem. Imagine doing these aggregations for 100,000 products! (A typical Wal-Mart stocks well over 200,000 products). Now add the store dimension (Major US chains have 1000s of stores), and you will get the idea of the scale problem. As a result, merchandize planning drives some challenging scalability requirements for databases and servers.

Table 1: Retail SCM & Operations – Business Processes & IT Drivers
Business Process Focus Key IT Drivers
Merchandise Planning Selecting the right products to purchase for the season/year, based on corporate objectives and setting sales targets Scalability Multi-level aggregation/dis-aggregation
Assortment Planning Grouping stores based on similar characteristics. Selecting what store groups have what products Optimization Algorithms for identifying the right store groups (clusters).
Transportation Planning & Logistics Delivering the product to the stores while minimizing transportation cost. Transaction Management for handling large volume of shipment orders
Optimization Algorithms for truck load building and route planning
Replenishment & Inventory Management Getting the right amount of the product to the store, while minimizing excesses and reducing out of stocks situations Scalability
‘Fast’ algorithms for calculating replenishments and inventory targets
Store Operations Presenting the products appropriately
Collecting POS data
Managing customer loyalty
Scalability POS Data Collection Systems
Business Intelligence & Data Mining
Algorithms for ‘Planograms’

In case of DeshMart, the problem is not as massive as Wal-Mart, but still quite big. At present, DeshMart has over 500 stores with anywhere from 10,000 to 50,000 products in a given store. Initially, at the beginning of the year, they had done the merchandize planning assuming a specific forecast value for the end of the year period. Now, they need to alter it, and propagate it down the hierarchy. This adjusts the forecast for individual products. This will in turn affect the purchasing decisions. In some cases (as it turned in DeshMart’s case…) it is too late to do this, since long lead time items are already on order. In such cases, various promotions/ discounting strategies are worked out to push the excess merchandize out. Note that given DeshMart’s unique customer loyalty and cost advantages, a down market can also be an opportunity. For example, Wal-Mart actually had more sales compared to previous quarters in the 2008 slowdown since the cost conscious consumer from other competing stores increasingly moved their shopping to Wal-Mart. Hence while adjusting the merchandize, DeshMart also considered this aspect as an input.

Once the product level forecast is available, the next challenge in a multi-store retail environment is deciding what stores carry what products. Not all DeshMart stores are the same. They differ by types of cities, as well as location of stores within cities. The typical product mix of a store in Central Deccan Gymkhana area of Pune is different from that in the Hadapsar suburb. A Mumbai store would differ in its product selection than say, a store in Indore. These product selections are referred to as ‘Assortments’ and planning them is called as ‘Assortment Planning’. Here too, scale is a big issue. Various algorithms are used to group stores based on their commonalities into groups or ‘clusters’. Then assortment decisions are made at the cluster level.

When the economic down turn hit, not only did the merchandizing decisions change, but also certain assortments by stores. To give an example stores in up market areas were now stocked with certain products normally allocated to more middle income areas. DeshMart was able to make these changes quickly by redoing certain clustering and changing allocations.

In both merchandizing and assortment planning IT plays a key role in providing the planners with a key capability to make fast and accurate decisions, while dealing with a huge amount of data. Handling large volumes of data, large scale aggregations and dis-aggregations, scenario planning &  what-ifs are also important IT requirements for these business processes.

Logistics & Transportation

If ‘Supply Chain Management‘ is loosely defined as ‘Getting the right product at the right place, at the right time’; then ‘Logistics & Transportation’ is one of the core execution pillars of realizing this. Logistics deals with the overall handling, distribution and shipment of products through the supply chain, while transportation is focused more on the physical shipment of goods and products. In a sense transportation can be considered as a subset of logistics, but often times these two terms are used interchangeably.

For large global retailers, the transportation problem typically begins at their warehouses. Product manufacturers are responsible for shipping material into these warehouses. (Note there are some exceptions such as Vendor Managed Inventory & Direct Store Shipments, but we will not discuss those here…).

The primary goal of efficient logistics & transportation planning is to get the product to the store at the right time, while minimizing cost. Warehouse management – ensuring smooth and efficient inflow and outflow of products is the first step. One relatively new technology that is being used in some places is ‘RFID’ (Radio Frequency ID). These are small tags (like a semiconductor chip) that are attached to stocking pallets, cases or other products that need tracking. A radio frequency based reader then ‘reads’ from this tag. This helps in easy tracking, sorting and distribution of products in a warehouse, while minimizing manual intervention. Some of these warehouses span many acres and have 1000s of pallets, miles of conveyor belt and typically handle over 100,000 individual products. Hence automated tracking is very important. RFID systems also need efficient large scale data acquisition and storage systems to handle this high volume data.

Truck load planning and truck routing are two important pieces of transportation planning. The challenge in truck load planning is filling up the truck to a full truck load with multiple products, while minimizing excessive shipments to the store (Note – It is always easy to ship a full truck load, if ‘stuffing’ it with unnecessary excess stuff is allowed…). The challenge comes in when this restriction of not shipping too much excess products comes in. Remember, excess product takes up excess space, as well as locks-up excess capital. This is bad for the overall financial performance. Various optimization based approaches that trade-off between cost of shipping early, vs. sending partial truck loads (thus trading off between excess inventory carrying costs vs. excess transportation costs…) are used to figure out the right loading mix inside a truck. In case full truck loads are not possible, then smaller shipments are loaded in, to be delivered to different destinations (typically different stores). This is called as ‘LTL Shipments’ (LTL = Less Than Truck Load). Here the challenge is to come up with a efficient truck route so as to minimize the distance traveled.

Hence if the DeshMart warehouse in Vashi, New Mumbai is shipping LTL shipments to the suburban stores in Bandra, Andheri and Mulund, the optimized route could consist of Vashi-Mulund-Andheri-Bandra. This seems relatively straight forward, but there are a lot of other constraints in the real world. There are some loading constraints, precedence constraints, traffic constraints, regulatory constraints that can influence the most optimal route on a map. Also, for a large retailer like Wal-Mart this process has to be done for 1000s of trucks every day. The IT systems have to deal with managing these whole sets of transactions as well as the decision making processes. They need efficient data integration with the IT systems of external logistics providers as well as suppliers.

In DeshMart’s case, there are also a series of local constraints that are peculiar to the Indian market. Shipping times in India can be fairly non-standard as compared to that in the US. Most truck operators are not organized into big companies. Regulatory requirements like Octroi (a local city tax) can add delays to the process. Enforcement of driving standards/time can also be a problem. Hence similar to Wal-Mart, DeshMart had made a strategic decision to own a private fleet of trucks for their transportation needs. This enables them with greater control over the whole process.

As we saw earlier, the impact of the economic slowdown led to last minute adjustments in assortments. Such changes, as well as those coming from sudden surges in demand can be better handled with a private fleet. DeshMart’s trucks also use the latest GPS based navigation and logging technology that enable the logistics master controller to keep exact track of each shipment in real time.

IT enabled dynamic logistics & transportation business processes helped DeshMart to better respond to the challenges of the ‘real’, ‘unplanned’ world, while keeping transportation costs at minimum.

Store Level Replenishment & Inventory Management

Store Level Replenishment & Inventory Management deals with calculating the right levels of products that are maintained at the individual stores. Too few and you run the risk of running out of stock, often resulting in lost sales and unhappy customers. Too many, and you take up excess space as well as occupy excess working capital.

Specialized replenishment and inventory management IT systems can react to daily fluctuations in the demand signals and pre-calculated forecasts at the store level and identify the right quantity of each product that needs to be shipped to the store. A variety of algorithms are used to do this, and like all other retail problems – scale is a big challenge. Imagine planning 100,000 products across 1,000 stores. The number of products-stores combination goes into millions! Now consider that this planning has to be done for the forecasted demand for the time horizon of next 2 weeks. Each day represents a new demand entry. Thus this further increases the problem size by an order of 14!

Daily demand fluctuations are usually computed based on ‘POS’ (Point-Of-Sale’) data. This data is often directly generated at the systems at the point where the sale takes place (e.g. cash register). POS Systems collect validate and transfer this data to the Replenishment System.

Through efficient store replenishment, DeshMart can make sure that they have the right product at the store, while keeping their costs low. The same cannot be said about their competitors! In fact, walk into any retail store today in India, and chances are you would find many of your preferred items to be out of stock. This goes a long way in generating the customer loyalty that DeshMart has been able to create over the years. What many of the new retail chains don’t seem to realize today (and what some ‘Neighborhood Kirana Stores’ do very well…) is that it is not the fancy layouts, air-conditioning, jazzy promotional material, etc. that attracts the customers! It is being repeatable and consistent and always having the fast moving goods in stock at all times – this is what the customer ultimately cares about!

Store Operations

Store Operations for DeshMart represents a great challenge and a terrific opportunity. Store operations in India can be quite different from that seen in the US or other developed countries. To start with, the store footprints are much smaller. The assortments are also smaller, but there is a lot of localization. For example, a large percentage of the assortment of a store in Chennai will differ from that in New Delhi. Managing store layouts and displays and locating the right stuff in the front, at the end aisles is very important. DeshMart uses CAD like software capabilities to do ‘Planograms’ (Planograms refer to the designing of products placement on the various shelves, while accounting for display priorities as well as the products’ volume dimensions). A fairly unique service in India is ‘home delivery’ service, provided by many grocery retailers. Ordering is either done over the phone or in person. A store level order entry and tracking system captures the order and coordinates the home delivery. DeshMart will be the first retailer in India to launch a completely web-based & call-center based ordering system, starting early next year. Here the order will be accepted and promised centrally and delivered from a central warehouse or a nearby store. This ‘hybrid’ web and brick and mortar model will be fairly unique not only in India but globally as well.

Customer loyalty is key for DeshMart. They have implemented a sophisticated customer loyalty program. A unique card/id number is assigned to a customer and rewards are given based on amount of purchase, as well as other special criteria. DeshMart collects, analyzes and mines customer buying preferences in their centralized business intelligence system and comes up with pricing and product placement strategies. Customer specific targeted emails and other specials are also managed through this system. For example, DeshMart’s data mining system can literally predict what special brand hair oil Mrs. Shah from Ahmadabad is likely to buy and at what frequency – and automatically send specials (or alerts) for the same!

All these entire store-centric systems ensured that even when the consumer spending all over India was going down, DeshMart still had their loyal customer continue to find and spend on the right product mix at their stores.

Conclusions and lessons learnt

In retrospect, the 2008 economic slowdown turned out to be a blessing in disguise for DeshMart. Through their superior business processes, management teams, and IT systems – they were able to not only react effectively to the changing market dynamics; they were also able to grab even higher market share. This same slowdown saw big troubles for many of DeshMart’s competitors, some of which like ‘Bharat Bears Mart’ actually went out of business.

Raj Deshpande reflects on this ‘interesting year’ and ponders how these 3 basic principles go a long way for his business success:

  • Focus on the customer – learn from the neighborhood Kirana Store.
  • Focus on costs at all costs – learn from the world leader, Wal-Mart.
  • Focus on leveraging IT for business – learn from industry leaders.
Reblog this post [with Zemanta]

Supply Chain Management in Consumer Goods – An In-Depth Look

Amit Paranjape, a regular contributor and primary adviser to PuneTech, had earlier written an article giving an overview of Supply Chain Management, and companies in Pune that develop software products in this area. This article, the next in the series, goes into details of the problems that SCM software products need to tackle in a consumer goods supply chain. This is a longer-than-usual article, hence posted on a Friday so you can read it over the weekend (assuming you are not attending one of the various tech activities happening in Pune this weekend.)

Here is a story about a packet of ‘Star Glucose Biscuits’ in ‘SuperMart’ on FC Road in Pune, told from the point of view of Supply Chain Management. Buckle up your seat belts because this story has tension, drama, emotion, and suspense (will the biscuits reach the shops in time for the T20 World Cup Promotion?)

Overview

The story begins at the Star Biscuits Factory in Bangalore where flour, sugar and other raw material are converted to the finished cases of biscuits. From Bangalore, the biscuits are shipped to a regional Distribution Center on the outskirts of Pune. This center then ships the biscuits to the local depots in different parts of cities such as Mumbai, Pune and from there they ultimately end up at the neighboring retail store, such as SuperMart on FC Road, Pune. In this seemingly simple journey are hidden a host of difficult business decisions and issues that arise on a daily basis. And to complicate matters further, we will throw in a few ‘interesting’ challenges as well! Throughout this story, we will take a deeper look at how the various business processes, and software programs associated with planning this entire supply chain network work in concert to bring you the extra energy and extra confidence of Star Glucose Biscuits.

This chain, from the raw materials all the way to the finished product sitting on the retail shelves is called the supply chain, and managing it efficiently is called supply chain management. Supply chain management is one of the most important aspects of running a manufacturing business, and doing it well has been the key to the phenomenal success of such giants as Walmart and Dell. The basic conflict that SCM is trying to tackle is this: you must have the right quantity of goods at the right place at the right time. Too few biscuits in the store on Sunday, and you lose money because have to turn customers away. Too many biscuits in the store and you have excess inventory. This is bad in a number of ways: 1. It eats up shelf space in the store, or storage space in your warehouse. Both of these cost money. 2. Your money, your working capital is tied up in excess inventory which is sitting uselessly in the warehouse. 3. If the biscuits remain unsold, you lose a lot of money. The same trade-off is repeated with intermediate goods at each step of the supply chain.

The Supply Chain in detail

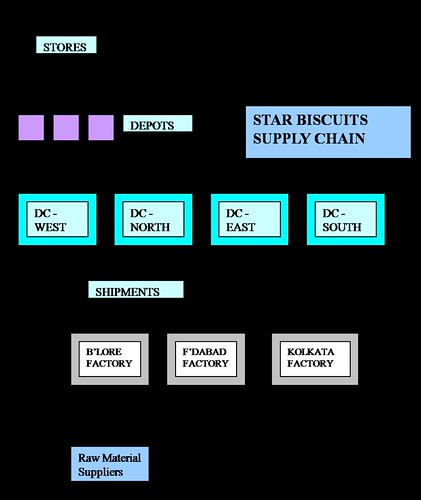
Schematic of a supply chain. From bottom to top: multiple suppliers supply raw materials to multiple factories. Finished goods are then sent to regional distribution centers. From there it goes to smaller regional depots, and finally to individual stores.

At the Star Biscuit factory in Bangalore, they are gearing up to meet forecasted production requirements that were recently communicated by the Star Biscuits headquarters (HQ) in Mumbai. This is the ‘demand’ placed on this factory. These production requirements consist of weekly quantities spread over next 12 weeks. The factory planning manager now has to plan his factory to meet these requirements on time.

Let us see what all he needs to take into account. First, he needs to figure out the raw material requirements – wheat flour, oil, sugar, flavors, etc. as well as packaging material. Each of them has different procurement lead-times and alternative suppliers. He needs to pick the time to place orders with the right suppliers so that the material is available on time for the manufacturing process.

The manufacturing process itself consists of two primary steps – making the biscuits from the flour, and packaging the biscuits into individual boxes and cases. Typically, multiple parallel making and packing lines work together to achieve the desired output. The packing process scheduling is often complicated further by a series of different sizes and packaging configurations.

Ensuring that the right amount of material is available at the right time is called Material Requirements Planning (MRP), and in the old days, that was good enough. However, this can no longer be done purely in isolation. Even if the amounts of the different raw materials required are predicted precisely, it can be problematic if the various making and packing machines do not have the capacity to handle the load of processing the raw materials. Hence, another activity, called capacity planning, needs to be undertaken, and the capacity plan needs to be synchronized with the materials requirement plan, otherwise excess raw material inventory will result, due to sub-optimal loading of the machines and excessive early procurement of raw material. Excess inventory translates to excess working capital cash requirement; which in the current hyper competitive world is not good! Luckily, today there are sophisticated APS (Advanced Planning & Scheduling) software tools that are far superior to traditional MRP systems that enable him to simultaneously do material and capacity planning.

Happy with the production plan for the next 12 weeks, the factory planner then makes sure that individual making and packing lines have their detailed production schedules for the next two weeks. The finished cases leave his factory on truck loads. But where do they go from here? The journey to SuperMart where our customer wants to purchase the final product is still far from over!

The next stop is a big distribution center (DC) for the western region that sits on the outskirts of Pune. This distribution center is housed in a large warehouse with multi-level stacking pallets (each pallet contains multiple cases) of multiple different products from the manufacturer. A set of conveyors and fork-lifts enable material to flow smoothly from inbound truck docks to stocking area, and from the stocking area, to the outbound truck docks. These products come not only from our Star Biscuits factory in Bangalore, but from various other Star Biscuits factories located all over India. In fact, some of these products could also be directly imported from the parent company of Star Biscuits in the UK (the ones with the bitter, dark chocolate!). This Pune distribution center stocks and stores this material in proximity to the western region – with specific emphasis on the large Greater Mumbai and Pune markets. How are all these warehousing related activities smoothly managed? The DC manager takes full advantage of a Warehouse Management System Software (WMS). The truck loading and load containerization is managed by a Transportation Management Module.

From here outbound shipments are sent to smaller regional depots that are located in the cities, nearer to the stores. From these depots, the biscuits are finally shipped to the stores to meet the end customer demand. How is this demand calculated? Clearly, it is impossible to predict the demands coming from individual customers at the store, few weeks in advance! Hence it is necessary to ‘forecast’ the demand.

Forecasting demand and determining stock levels

Who decides how much material to stock? And how is it calculated? Clearly, as we briefly indicated earlier, keeping too much product is costly and keeping too little results in stockouts (material unavailability on store shelf) at the stores, thereby resulting in unhappy customers and lost sales. Too much product equals excess working capital (similar to the excess raw material problem) and is not good for the company’s financial performance. Too little, and we will run out if there are any major demand swings (commonly referred to as ‘demand variability’). To achieve the optimum level of the desired stock on hand to buffer against demand variability a ‘safety stock quantity’ is maintained in the warehouse. This quantity is computed by the central Supply Chain Management (SCM) team at HQ.

The actual computation of the safety stock for different products in the distribution center is calculated using a statistical computation (In some cases, a manual override is also done over the computed value). The most common technique consists of using Poisson distribution, demand & supply variability historical data, demand & supply lead time data, and desired customer service levels. Customer service levels are assigned based on an “ABC” classification of the products. ‘A’ category items are the fast movers and have a high revenue share and are typically assigned a 99% customer service level. Roughly speaking, a ‘99%’ customer service level implies that the safety stock quantity is adequate to guard against demand variability signals 99 times out of 100. Proactive planning on a daily basis that involves daily monitoring of stocks of all products is done, based on actual outbound shipments, can many times help in even reacting to that ‘1 in 100’ cases with rapid corrective measures.

The forecasting process for all the products is done at Star Biscuits Head Quarters. Let us continue with our example of ‘Star Glucose Biscuits’. The modern forecasting process is more accurately referred to as a ‘Demand Planning’ process. Statistical forecast is one input to the overall process. Statistical forecasts are derived from shipment history data and other input measures such as seasonality, competitor data, macro-economic data, etc. Various statistical algorithms are used to come up with a technique that reduces the forecasting error. Forecasting error is typically measured in ‘MAPE’ (Mean Absolute Percentage Error) or ‘MAD’ (Mean Absolute Deviation).

The statistical forecast is then compared with the sales forecast and the manufacturing forecast in a consensus planning process. This is often done as part of a wider ‘Sales & Operations Planning Process’ in many companies. Often times, a ‘top-down’ and ‘bottom-up’ forecasting technique is used. Here, individual forecasts at the product level are aggregated up the product hierarchy into product group forecasts. Similarly, aggregate product group level forecasts are disaggregated down the same hierarchy to the individual product level. These are then compared and contrasted and the expert demand planner then takes the final decision. Aggregated forecasting is important, since often times this reduces the forecast error. In case of Star Glucose Biscuits, the aggregated product hierarchy would first combine all sizes (e.g. 100 gm, 200 gm), then aggregate along sugar based biscuits type, and then into ‘All biscuits’ groups.

The end result of the demand planning process is the final consensus forecast that is calculated in weekly time intervals (commonly referred to in planning terminology as ‘buckets’) for a time horizon of 8-12 months. The demand forecasts drive the entire Star Biscuits Supply Chain. To simplify the overall Demand Planning process, modern DP software tools provide great help in statistical forecasting, OLAP based aggregation/disaggregation, and in facilitating interactive collaborative web-based workflows across different sets of users.

Managing the Supply Chain

It was easy if all we had was one DC in Pune and one factory in Bangalore, supplying to one store. But Star Biscuits has a much more extensive network! They have multiple factories throughout India and the same biscuits can be produced by each factory. How much of the demand to allocate to which factory? This problem is addressed by the Supply Chain Management (SCM) team that works in close concert with the Demand Planning team. The allocation is made based on various criteria such as shipment times, capacities, costs, etc. In coming up with the sourcing, transportation and procurement decisions – minimizing costs and maximizing customer service are amongst the top business objectives.

Now, getting back to Star Biscuits, they have over 300 products across 5 factories and 4 DCs. The DCs in turn, receive demand from nearly 100 depots that are supplying to thousands of stores all over India. Determining the optimal allocation of demands to factories, safety stocks to DCs and all the transportation requirements is beyond the abilities of humans. Such a complicated scale and decision problem needs computer help! Luckily, advanced SCM software tools can help the SCM team make these decisions fairly efficiently. Good SCM tools allow user interactivity, optimization, and support for business specific rules & heuristics. The SCM process thus determines the 12 week demand in weekly buckets for our factory in Bangalore, where we started.

To summarize, the overall supply chain – we saw how the product demand gets forecasted at HQ by the demand planning group. The SCM group then decides on how to allocate and source this demand across the different factories. They also decide on the ideal safety stock levels at the DCs. The WMS group ensures the efficient management of the distribution center activities. The factory planner team decides on the most efficient way to produce the biscuits demand allocated to their plant. The transportation management team is assigned the task of shipping material across this network in the best possible way to reduce cost and cut down on delivery times.

Dealing with drastic changes

And all of this is just to do “normal” business in “normal” times.
All the processes described earlier are great if the business works at a stable, reasonably predictable pace. Our safety stock policies guard against the day to day variability. But what about drastic changes? Unfortunately in the current environment, the only thing that is constant is ‘change’.

Here is what happened at Star Biscuits. One day, out of the blue, the entire planning team was thrown into a mad scramble by a new request from the marketing department. In order to react to a marketing campaign launched by one of their top competitors, the marketing department had a launched a new cricket promotion of its own for the next month.

Promotions are extremely important in the consumer goods industry. They entail targeted customer incentives, advertising spending and custom packaging – all in a synchronized fashion. The success of promotions often times make or break the annual year performance of a Consumer Goods Company. Promotions driven sales often times contribute large double digit percentage of total sales of consumer goods companies.

This particular cricket promotion involved a special packing requirement with the star logos on the packet. The target customer demand was not only upped by 50%, the offer also had a ‘Buy 1 Get 1 Free’ incentive. As a result, the total demand was going up by nearly 300%.

The SVP in charge of Supply Chain was trying his best to get a handle of the problem. He was getting irritated by the constant pressure he was under from the SVP Marketing, and the CEO.

The demand planning team had to quickly alter its demand numbers to meet the new targets. The real trouble spot was brewing at the SCM team. The team had to rapidly make decisions on where to source this sudden demand spike. While cost optimization is important, meeting customer demand at ‘all costs’ is the key. The Bangalore factory was already running at 90% capacity and was in no position to produce much more. Luckily for the SCM team, their SCM tool quickly ran a series of scenarios and presented possible alternatives. These scenarios looked at various alternatives such as contract packing, new factories, expedited raw material shipments, direct shipments from the factories to the stores, etc. One of the resulting scenarios seemed to fit the bill. It was decided that bulk of the extra demand be routed to the alternative factory in Faridabad which had some spare capacity. From here, the product was going to be shipped directly (where feasible) to the Mumbai and Pune depots, where a large chunk of the promotion driven demand was expected. The rest of the country’s demand was going to be met by the conventional approach, from the Bangalore factory. The new package also resulted in demand for new packaging material with the cricket logos. New scenarios were generated that source this material from packaging material suppliers from the middle-east. (Interesting to note, that in some time crunched promotions, packaging material often times ends up being the bottle neck!)

Satisfied with this approach, the SVP Supply Chain ordered his team to come up with process improvements to prevent such scrambles in future. Luckily there was an easy solution. The Demand Planning software tool had a nice capability to support an integrated promotions planning & demand planning workflow. Such workflows look at various promotions related data, such as timing, costs, volume, competitor strategies and efficiently plan future promotions – instead of reacting to them at the last minute. In turn, such effective promotion planning can not only drive revenues, but also further improve supply chain efficiencies.

The SVP is happy, but what happened to our end customer on FC Road Pune? Well, she walked away happy with her promotion pack of Star Glucose biscuits, completely oblivious of what had happened behind the scenes!

About the Author – Amit Paranjape

Amit Paranjape is one of the driving forces behind PuneTech. He has been in the supply chain management area for over 12 years, most of it with i2 in Dallas, USA. He has extensive leadership experience across Product Management/Marketing, Strategy, Business Development, Solutions Development, Consulting and Outsourcing. He now lives in Pune and is an independent consultant providing consulting and advisory services for early stage software ventures. Amit’s interest in other fields is varied and vast, including General Knowledge Trivia, Medical Sciences, History & Geo-Politics, Economics & Financial Markets, Cricket.

Supply Chain Management (SCM) Overview and SCM Development in Pune

by Amit Paranjape

Have you ever wondered how much planning and co-ordination it takes to roll out Indicas smoothly off the Tata Motors assembly line? Consider this – A typical automobile consists of thousands of parts sourced from hundreds of suppliers, and a manufacturing and assembly process that consists of dozens of steps. All these different pieces need to tie-in in an extremely well synchronized manner to realize the end product.

How is this achieved? Well, like most complex business challenges, this too is addressed by a combination of efficient business processes and Information Technology. The specific discipline of software that addresses these types of problems is known as “Supply Chain Management” (SCM).

Pune has a strong manufacturing base and leads the nation in automotive and industrial sectors. Companies such as Tata Motors, Bajaj Auto, Kirloskar Oil Engines, Cummins, and Bharat Forge are headquartered in Pune. The manufacturing industry has complex production and materials management processes. This has resulted in a need for effective systems to help in decision making in these domains. The discipline that addresses these decision making processes is referred to as ‘Advanced Planning & Scheduling’ (acronym: APS). APS is an important part of SCM. This article briefly discusses some of the basic concepts of SCM/APS, their high-level technology requirements, and mentions some Pune based companies active in this area. Note, given Pune’s manufacturing background, it is no accident that it is also a leader in SCM related software development activities in India.

Introduction to SCM

Supply chain management (SCM) is the process of planning, implementing and controlling the operations of the supply chain as efficiently as possible. Supply Chain Management spans all movement and storage of raw materials, work-in-process inventory, and finished goods from point-of-origin to point-of-consumption. SCM Software focuses on supporting the above decision making business processes that cover demand management, distribution, logistics, manufacturing and procurement. APS specifically deals with the manufacturing processes. Note, SCM needs to be distinguished from ‘ERP’ that deals with automating business process workflows and transactions across the entire enterprise.

Decision Making’ is vital in SCM and leads to a core set of requirements for SCM software. Various decision making and optimization strategies are widely used. These include Linear Programming, Non-Linear Programming, Heuristics, Genetic Algorithms, Simulated Annealing, etc. These decision making algorithms are often implemented in C or C++. (In some cases, FORTRAN still continues to be leveraged for specific mathematical programming scenarios.) Some solutions use standard off-the-shelf optimization packages/solvers such as ILOG Linear Programming Solver as a component of the overall solution.

Consider a typical process/paint manufacturer such as Asian Paints. They make thousands of different end products that are supplied to hardware stores from hundreds of depots and warehouses, to meet the end consumer demand. The products are manufactured in various plants and then shipped to the warehouses in trucks and rail-cars. Each plant has various manufacturing constraints such as 1) a given batch mixer can only make certain types of paints, 2) to reduce mixer cleaning requirements, different color paints need to be produced in the order of lighter to darker shades. Now, to make it more interesting, there are many raw material constraints! Certain raw materials can only be procured with a long lead time. An alternative raw material might be available earlier, but it is very expensive! How do we decide? How many decisions are we talking about? And remember, these decisions have to be synchronized, since optimizing any one particular area in isolation can lead to extremely bad results for the other, and an overall sub-optimal solution. In optimization language, you can literally end up dealing with millions of variables in solving such a problem.

SCM software also has a fairly specific set of GUI requirements. A typical factory planner will deal with thousands of customer orders, machines, raw material parts and processing routings. Analyzing and acting on this information is often challenging. A rich role based user workflow for the planner is a critical. GUIs are usually browser-based with custom applets wherever functionality richness is needed. In very specific cases, ‘thick’ desk-top based clients (typically developed in Java) are also required for some complex workflows. Alerts and problem based navigation are commonly used to present large amounts of information in a prioritized, actionable format. Rich analytical OLAP type capabilities are also required in many cases.

Integration is an important part of SCM software architecture. SCM software typically interacts with various Enterprise IT systems such as ERP, CRM, Data-Warehouses, and other legacy systems. Many inter-enterprise collaboration workflows also require secure integration with customer/partner IT systems via the internet. Both batch and real-time integration workflows are required. Real-time integration can be synchronous or asynchronous. Batch data can sometimes (e.g. in Retail SCM) run into terabytes and lead to batch uploads of millions of lines. Loading performance and error checking becomes very important.
Consider a computer manufacturer such as Dell. They are renowned for pioneering the rapid turnaround configure-to-order business. Dell assembly plants sources material from different suppliers. In order to get maximum supply chain efficiencies, they actively manage raw material inventory levels. Any excess inventory results in locked-in capital and a reduction in Return on Investment (ROI). In order to achieve effective raw material inventory management, Dell needs to share its production and material requirements data with its suppliers so that they can supply parts at the right time. To achieve this, there needs to be a seamless real-time collaboration between the Dell procurement planner and the suppliers. Data is shared in a secured fashion via the internet and rapid decisions such as changes to quantity, selecting alternate parts, selecting alternate suppliers are made in real-time.

SCM in Pune

Most of the large manufacturing companies in Pune leverage some kind of SCM software solutions. These are typically sourced from SCM software industry leaders such SAP, i2 and Oracle. In some cases, home grown solutions are also seen.

Many small and med-sized software product companies in Pune are focused on the SCM domain. Some offer comprehensive end-to-end solutions, while others focus on specific industry niche areas. Note that by its very nature, SCM processes are fairly complex and specifically tailored to individual companies. As a result many SCM products are highly customizable and require varying degrees of onsite development. This leads to software services as an integral part of most of these SCM product companies.

Pune based FDS Infotech has been developing SCM and ERP software suite for over a decade. They have a wide customer base in India. A representative example of their solution can be seen at Bharat Forge. Here their SCM/APS solution is being used to maximize the efficiency of the die shop. This is achieved through better schedule generation that considers all the requisite manpower, machine and raw-material constraints.

Entercoms, also based in Pune, is primarily focused on the Service Parts Management problem in SCM. Their customers include Forbes Marshall and Alfa-Laval.

SAS, a global leader in business intelligence and data-analytics software also develops various SCM solutions, with specific focus on the Retail segment. Their Retail solution focuses on a wide variety of problems such as deciding the right merchandizing strategies, planning the right assortments for the stores, forecasting the correct demand, etc. They boast a wide global customer base. Their Pune R&D center is involved in multiple products, including their Retail solution.

In addition to these three, many other small SCM software companies in Pune work on specific industry niches.

About the Author

Amit Paranjape is one of the driving forces behind PuneTech. He has been in the supply chain management area for over 12 years, most of it with i2 in Dallas, USA. He has extensive leadership experience across Product Management/Marketing, Strategy, Business Development, Solutions Development, Consulting and Outsourcing. He now lives in Pune and is an independent consultant providing consulting and advisory services for early stage software ventures. Amit’s interest in other fields is varied and vast, including General Knowledge Trivia, Medical Sciences, History & Geo-Politics, Economics & Financial Markets, Cricket.

Reblog this post [with Zemanta]